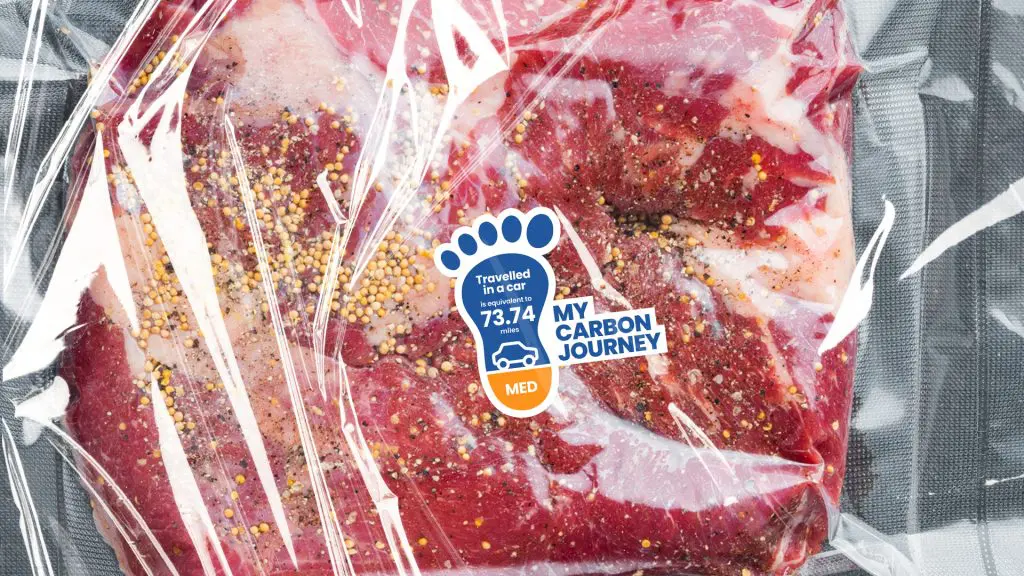
New research draws on AI to showcase what supermarket shelves could look like if they they illustrated their CO2 emissions.
The research, which was conducted by consultant Ashbury, used figures from the BBC’s Climate Change Food Calculator to establish the amount of CO2 per kg emitted for each portion of food.
Ashbury looked at the number of miles travelled in a petrol car, the number of days heating an average UK home, and the number of litres of water used, and used Midjourney to produce images of what these labels might look like.
Using examples such as miles travelled in a petrol car, the number of days heating an average UK home, litres of water used, number of showers lasting 8 minutes or longer.

Subscribe to Sustainability Beat for free
Sign up here to get the latest sustainability news sent straight to your inbox everyday
“So much is already being done by manufacturers and retailers to keep consumers informed on what is going into their food,” said Asbury technical coordinator Jade Collins.
“For example, the traffic light system which which came in over a decade ago has been able to provide some further clarity to consumers to identify whether a product is considered healthy or not.”

She continued: “But it’s interesting to see consumers now going that step further and keen to get even more information on how their food was manufactured and produced but crucially the impact that the process has had on the environment.”
“The ball is now in the court of the manufacturers and producers to answer consumers’ challenge to provide more information about the impact of their foods. This research gives us an indication as to what this future might look like.”

Axiom sustainability software cofounder Daniel Usifoh said: “For food manufacturers, gathering accurate data on Scope 1 and 2 emissions like energy, process steam and fuel use is reasonably straightforward.”
“Scope 3 – supply chain emissions – is where the big challenge lies. Many manufacturers simply don’t have enough information on where their ingredients come from – let alone how they are grown or produced!,” he added.
“Filling these data gaps is the only way to get an accurate carbon footprint measurement – and this starts with effectively mapping the supply chain.”